Plants as Environmental Sensors: Citizen Science Data Reveal the Impact of Urbanization on Climate and Soils
How healthy is the environment of our cities? Plants reflect urban climate and soil conditions with remarkable precision. Using more than 80 million observations from plant identification apps, researchers at the Max Planck Institute for Biogeochemistry have produced a detailed picture of fine-scale climate and soil conditions for 326 European cities. The result: built-up areas are warmer and drier; their soils are more mechanically disturbed, saltier, and more alkaline than those of urban green spaces such as parks or forests. While built-up areas are strikingly similar across Europe, urban forests preserve the natural diversity of their original environmental conditions. The study was published today in the journal Nature Cities.
Plants as Living Sensors of the Urban Environment
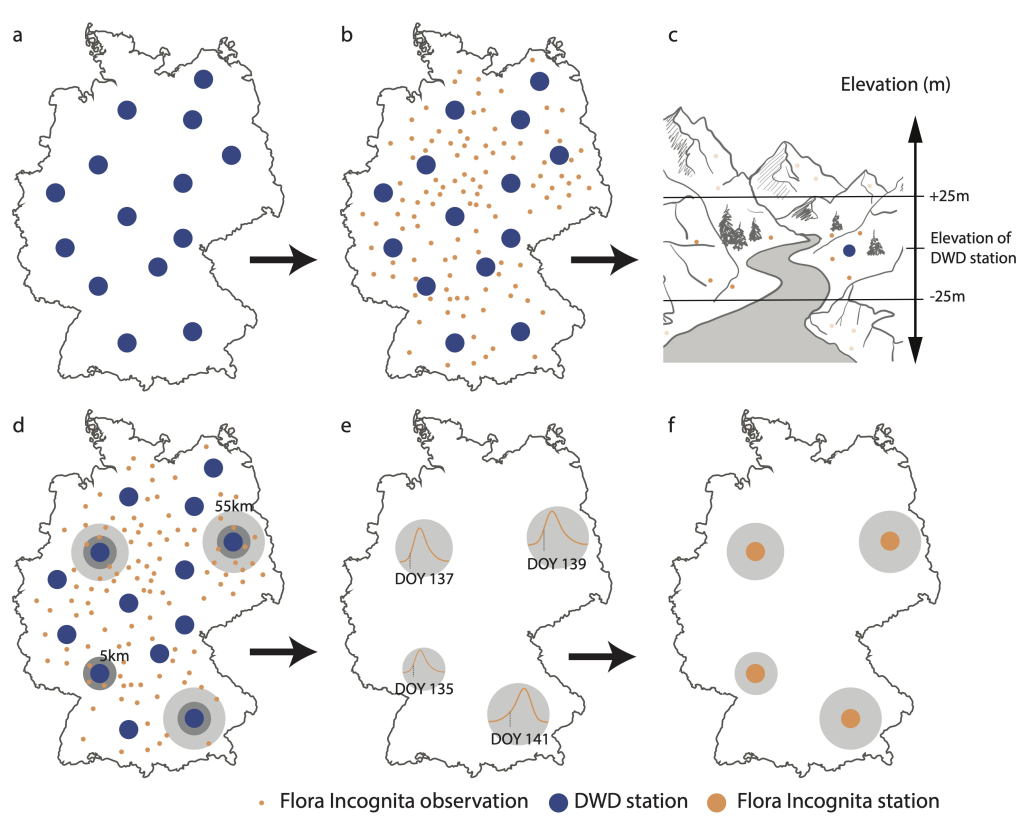
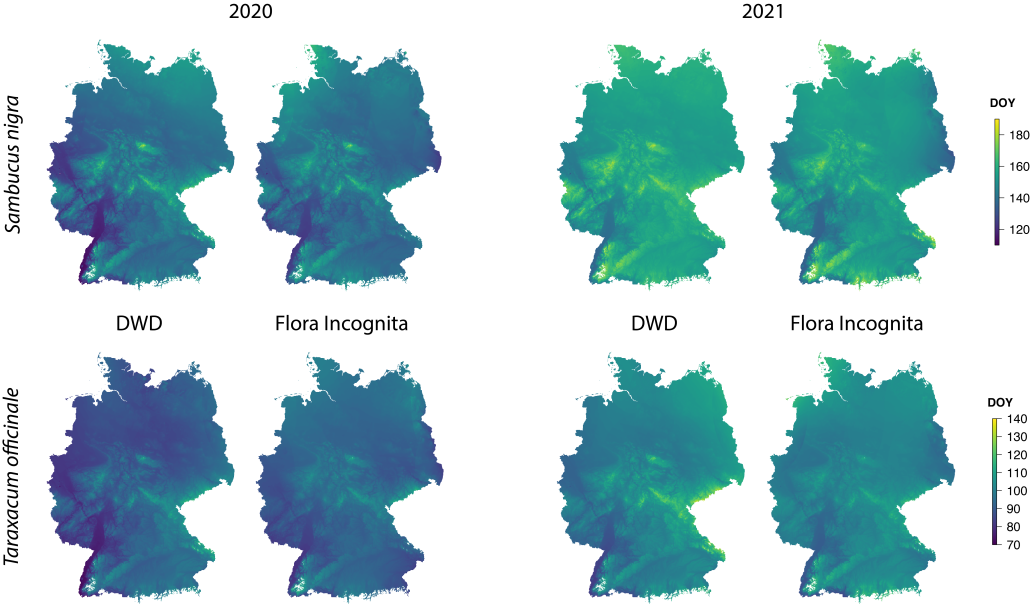
By 2050, around 70% of the world’s population will live in cities. Yet urban environmental conditions are still poorly or only coarsely documented. A new study published in Nature Cities demonstrates how plants can capture fine-scale climate and soil characteristics and reveal human impacts. The study is based on plant observations collected via identification apps such as Flora Incognita.
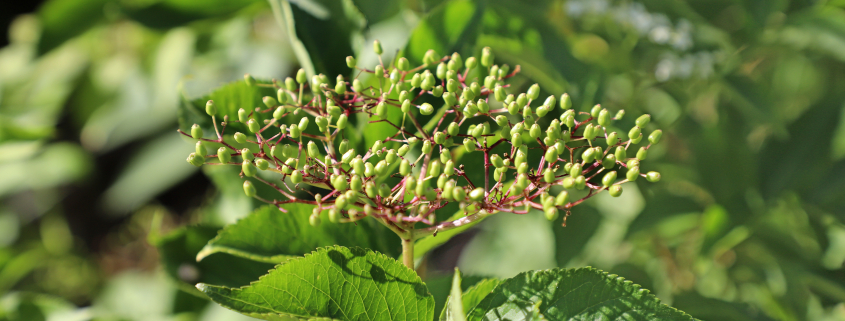
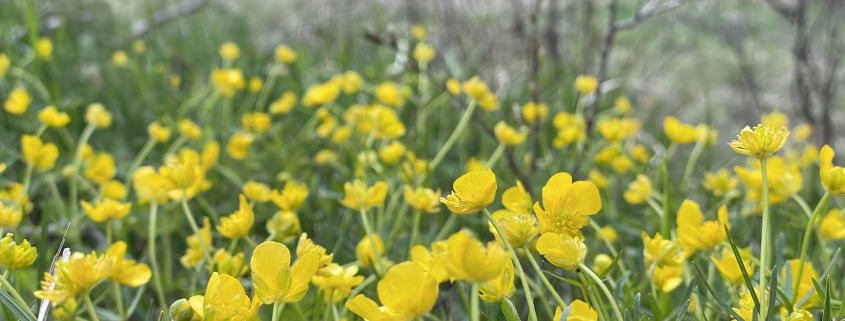
“Plants grow where their site requirements are met,” explains Dr. Susanne Tautenhahn, first author of the study. “Stinging nettles indicate nutrient-rich soils, marsh marigolds prefer wet sites, and salt-tolerant species like alkali grass thrive along salted roads.” In this way, factors such as temperature, soil moisture, pH, salinity, or disturbance can be inferred indirectly through plant occurrence.
This approach is particularly powerful in cities: the sheer number of observations yields highly precise data, while classical measurements often fail to capture strong spatial heterogeneity. “Even between concrete and asphalt, plants reveal very accurately how warm or dry a site is, or whether the soil has been heavily disturbed,” says Tautenhahn.
Old Knowledge Meets New Data
The vision was to combine decades of knowledge about plants as living environmental sensors with large-scale citizen science data. This led to a new, plant-based approach for assessing fine-scale climate and soil conditions in cities.
“The approach is comparable to remote sensing—except that we use plants, smartphones, and an engaged crowd of citizens instead of satellites,” explains Tautenhahn. “We call this new form of environmental observation Mobile Crowd Sensing of Environments (MCSE).”
The interdisciplinary author team brings together expertise from botany, ecology, soil science, computer vision, citizen science, and remote sensing. Each perspective contributed to transforming citizen-generated plant observations into an unprecedented, detailed picture of urban environmental conditions.
“Only recently has the previously mostly regional knowledge of plant species’ site requirements—expressed in so-called ecological indicator values—been harmonized across Europe,” says Prof. Dr. Jürgen Dengler. “This allows environmental conditions such as soil moisture, nutrient availability, or light, but also disturbances like intensive soil management, to be visualized across Europe for the first time,” adds Prof. Dr. Milan Chytrý. Both played a key role in the Europe-wide standardization of the indicator value systems used in the study.
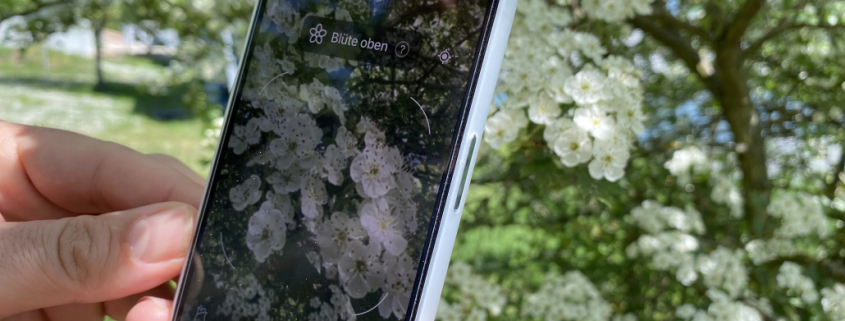
The decisive breakthrough for large-scale application came from millions of plant observations made possible by citizen science and AI-based identification methods.
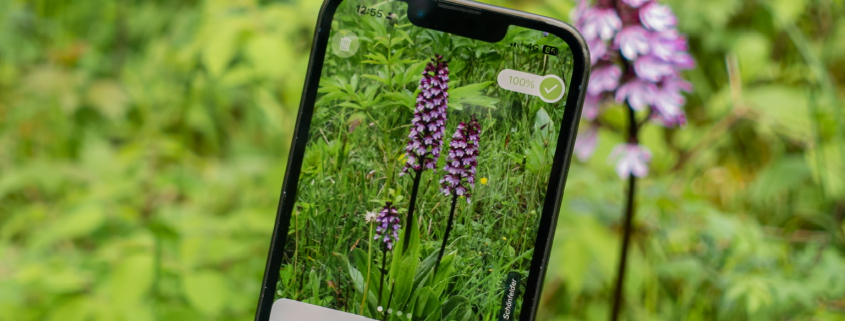
“Plant identification apps greatly facilitate biodiversity recording by citizens and provide large numbers of observations, especially in urban areas,” emphasizes Dr. Jana Wäldchen, research group leader at the MPI for Biogeochemistry and co-lead of the Flora Incognita project.
Prof. Patrick Mäder, co-project leader of Flora Incognita, adds: “For a long time, AI-based plant identification was considered hardly feasible, and the resulting data too unstructured for research. This study clearly shows the opposite: innovative questions at large spatial scales require new data streams—and Flora Incognita has become an important tool for this purpose.”
What Plants Reveal About Cities
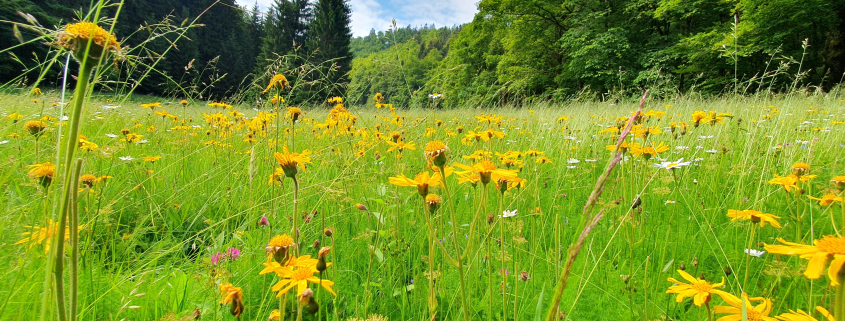
Across Europe, built-up areas are warmer, drier, and darker than the green spaces within the same cities. Their soils are more alkaline, saltier, poorer in nutrients, and more strongly disturbed by mechanical soil management than those in parks or urban forests. Urban forests, in turn, provide important ecosystem services such as cooling and water retention. Differences within a single city can be as large as those between cities thousands of kilometers apart—for example, between Madrid and Stockholm. Yet despite this intra-urban diversity, built-up areas are remarkably similar across Europe, indicating urban homogenization. Urban forests, by contrast, retain their original local environmental conditions and thus preserve natural diversity.
“Cities are places where environmental problems become visible—but also where solutions can emerge,” emphasizes Tautenhahn. Plants are more than a green backdrop: they make hidden environmental conditions visible and provide new approaches for monitoring, research, policy, and urban planning—toward sustainable, resilient, and livable cities.
Funding
This study was conducted as part of the project Flora Incognita Moni: Biodiversity Monitoring with Flora Incognita, a joint project of the Technical University of Ilmenau and the Max Planck Institute for Biogeochemistry in Jena. It is funded by the German Federal Agency for Nature Conservation and the National Monitoring Centre for Biodiversity with resources from the Federal Ministry for the Environment, Climate Action, Nature Conservation and Nuclear Safety.
The publication
Tautenhahn, S., Jung, M., Rzanny, M., Mäder, P., Reichstein, M., Ahrens, B., Bebber, A., Boho, D., Chytrý, M., Dengler, J., Jansen, F., Katal, N., Midolo, G., Tichý, L., Walther, S., Weber, U., Wittich, H. C. & Wäldchen, J. (2026). Urbanization signatures on climate and soils uncovered by crowd-sensed plants. Nat Cities. https://doi.org/10.1038/s44284-025-00378-9